It's been 9 years now since I first hit on the idea of Early Retirement Extreme back in 2014 and got a bit obsessed with it.
Long story short is that my obsession sort of yielded dividends, and I am now semi-retired, but still not fully early retired.
Although TBH my priorities have changed a bit and now that I only need to work part time I don't mind the idea of working at al, in fact I quite fancy the idea of getting a regular job.
But it's still a good time for me to review my original look at ERE.
One of my starting points was to use national UK statistics to see how Mr Median fared on average wages and expenditure RE retirement - things have got WORSE in the last decade, and so have things for anyone wanting to pursue an ERE model, it'll take you longer now to stack enough cash to retire early than it would have done had you started in 2014...
The last time I updated my stats was in 2016 - here! back then I worked out a 28 year old could retire through ERE at 44 in the UK based on average income and frugal expenditure figures
Below is my 2023 updated version of the above, NB I use a 35 year old in this, but our 2023 35 year old can't retire until 58!
So that's:
- 2016: 16 years for a 28 year old to retire by 44.
- 2023: 23 years for a 35 year old to return by 57.
NB even with the different start dates you can see the difference is profound!
Even with the extra compounding that 28 year old early starter would be pushing into their early 50s for retirement today, given the extra years they'd need compared to our late starter
Anyway, the 2023 update....!
A critique of the curiously ordinary life of the everyday worker consumer...
A frugal consumer (aged 35) can retire 10 years earlier than an average consumer based on the current median income!
The basis of this comparison is two hypothetical individuals (see link 5 below) who both earn the median UK salary. One individual has average consumption and expenditure while the other has in mind the goal of retiring as early as possible and so is much more frugal, without completely having cut themselves off from society.
To get the averages I’ve used the Office for National Statistics (ONS) Family spending in the UK: April 2021 to March 2022 and the Earnings and working hours survey 2023 (3 and 4 below).
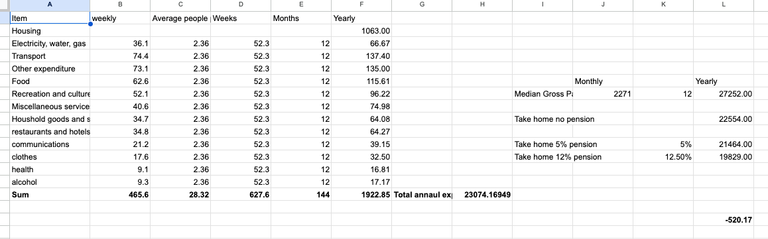
According to the Earnings and working hours survey the median, full-time gross weekly gross annual salary works out at £27, 252. This equates to a take home annual salary of £22, 554 after income tax and national insurance are taken out. This assumes no pension contributions (See 5 below for links, 2022–3 figures).
The decision to compare two hypothetical single people is down to three factors:
- A single person simply has more control over their finances than a couple or a family.
- There is a trend towards more people living alone.
- It reflects my own personal experience.
To get my figures for individual expenditure based on one individual living alone I’ve divided the ONS’ family spending household data by the average household size (2.3) where it makes sense to do this (dividing makes sense for clothes, but not for council tax). Because the figures are mostly weekly, I’ve multiplied by 52.3 to get the annual figures.
Where housing costs are concerned, I’ve used the average mortgage repayments for a terraced house, based on the fact that this is the most rational type of property to purchase even for a single person. Flats lock you into service charges which you are stuck with for life and can spiral, trust me I’ve been there and am not going back! (See 5 below for links, 2022–23 figures).
Although the figures in each expenditure category will vary considerably depending on variables such as age, or household makeup, the levels of expenditure are generally not going to be that far away from how the majority of people spend their money for much of their lives, and thus most people should at least recognise something of their own and their friends’ expenditure habits in these figures.
However, to satisfy those who just can’t get over the problems of using averages when variables which will differ widely, I’ve included a link (5) to the spreadsheet where I’ve done my calculations so you can add in your own expenditure and income levels in order to personalise these calculations for yourself, or you can even modify at a deeper level to add in things such as inflationary effects, investment returns and changes in circumstance over time.
Executive summary — A comparison of the income and expenditure of an average-consumer compared to a hypothetical frugal-consumer.
According to the data (3, 4) the average income and average expenditure figures work out as follows:
- Average Income £22 554
- Average Expenditure £23 074
- Annual difference -£520
YOWSER!
So someone who is earning the median income of £22.5K a year and who has average expenditure would be £520 in debt at the end of the year!
Now that’s depressing: the average earner CANNOT enjoy even average expenditure, so they’d have to cut back on SOMETHING.
According to the data (3, 4) the average income and frugal expenditure figures work out as follows:
- Average Income £ 22 554
- Average Expenditure £ 17 877
- Annual difference £ 4676
To arrive at the expenditure I simply cut down everything that I subjectively regard as non-essentials to much lower, so I’ve drastically reduced culture and recreation expenditure and similar categories.
£4676 works out at £389 to save a month, and if our frugal consumer were to compound that monthly at 5% then after 23 years they would have £200, 700 in the bank.
I think a reasonable starting age for this model is 35, giving someone a chance to be well established in their career and get on the property ladder, so after 23 years they’d be 58, which with £200K in the bank gives then £20K a year to get through to the current state pension age of 68 with £20K a year.
Or that still gives them £17K a year if the pension age has gone up to 70 by then, which it probably will have!
So, our frugal consumer can retire 10 years earlier than our average consumer based on the current median income!
Potential problems with my modelling
Firstly, I don’t take into account inflation, I’ve just worked out everything at today’s prices, and neither do I take into account any returns you might make investing rather than paying down the mortgage, which is the main early-retirement strategy in my scenario. However, these two things being equal in both my average and frugal-consumer examples, you are still a lot better off spending as little as possible on anything other than the mortgage or savings.
Another potential limitation of the model is that it is mainly based on someone having a stable job, and being single, although it is possible to ‘stick to the programme’ while moving around jobs and holding down a relationship, maybe even kids, just a lot more difficult.
Sources
(4) https://www.ons.gov.uk/employmentandlabourmarket/peopleinwork/earningsandworkinghours
(5)Table 1 — https://docs.google.com/spreadsheets/d/1ZhS7j75-82GSBQTbvhioYavpC8UDq1kPEHgDVAuHCy8/edit?usp=sharing
Posted Using LeoFinance Alpha


