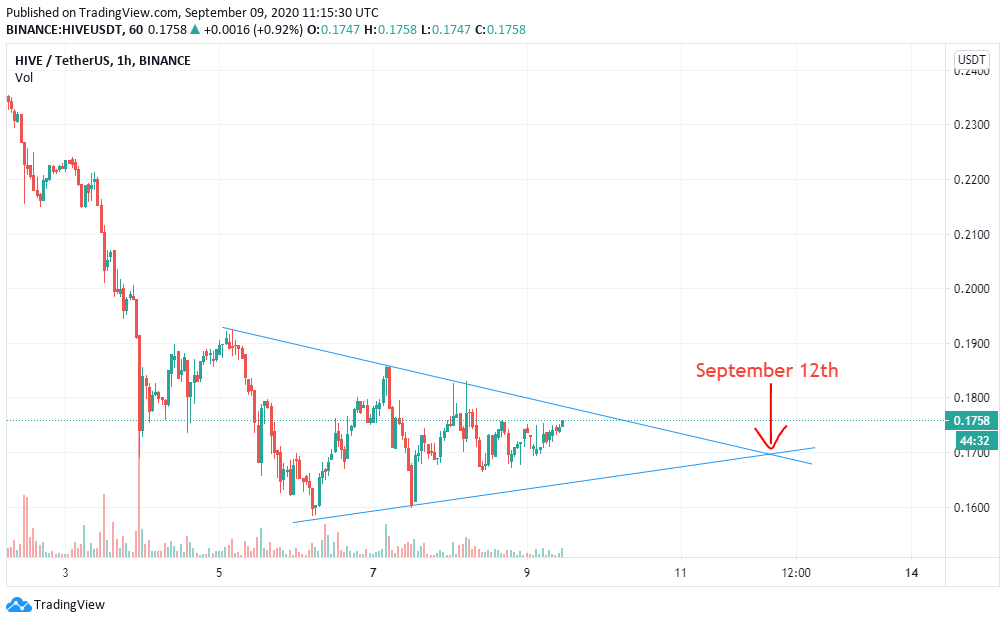
I just proceeded to cancel some of my orders after glancing at candles chart for 24 hours and 14 days on @coingecko I have only been trading for 3+ years, but this was a classic setups that is hard to miss even for a total rookie. I know that @leofinance community has many experienced traders and day traders have probably already picked up on this. This could be a quick opportunity to make some quick gains (or simply HODL with confidence). If you are feeling bad after 25% -30% losses on both STEEM and HIVE, you ca be a little happier now.
HIVE Short Term Chart (Data From Binance)
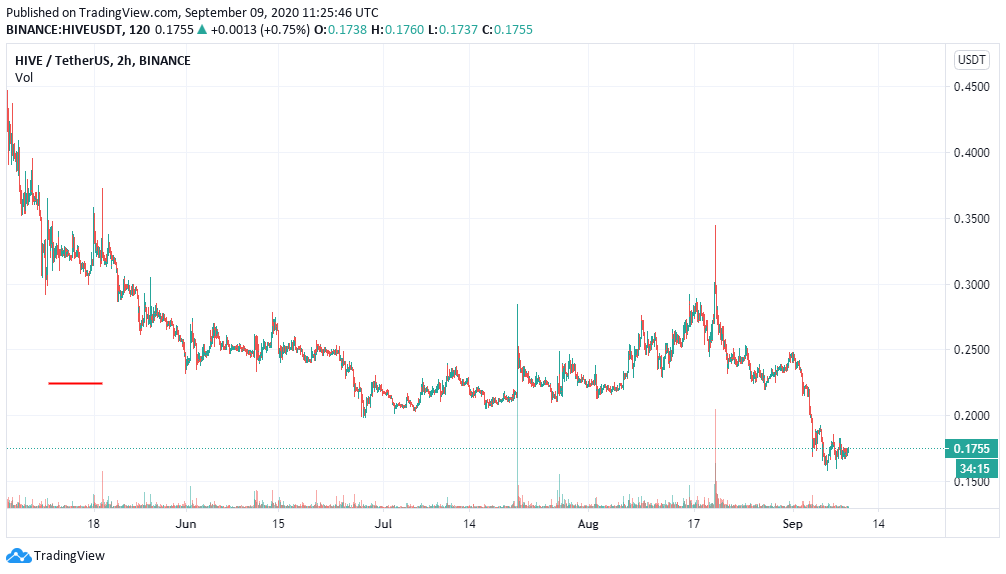
Cup & Handle For The HIVE Long Term Chart?
:max_bytes(150000):strip_icc():format(webp)/CupandHandleDefinition1-bbe9a2fd1e6048e380da57f40410d74a.png)
A cup and handle price pattern on a security's price chart is a technical indicator that resembles a cup with a handle, where the cup is in the shape of a "u" and the handle has a slight downward drift. The cup and handle is considered a bullish signal, with the right-hand side of the pattern typically experiencing lower trading volume. The pattern's formation may be as short as seven weeks or as long as 65 weeks.
HIVE Chart Since May 4th, 2020
STEEM & HIVE Are Much Similar In Average Trader's Eyes
There are millions of dollars in daily value is in these assets and not many of them are STEEM/HIVE users. They don't have an in depth understanding of what is happening in the two blockchains. The number of daily accounts transacting has fallen far from its peak. Take a look at the statistics published by @penguinpablo

STEEM Chart (Binance) Since April 15th, 2020
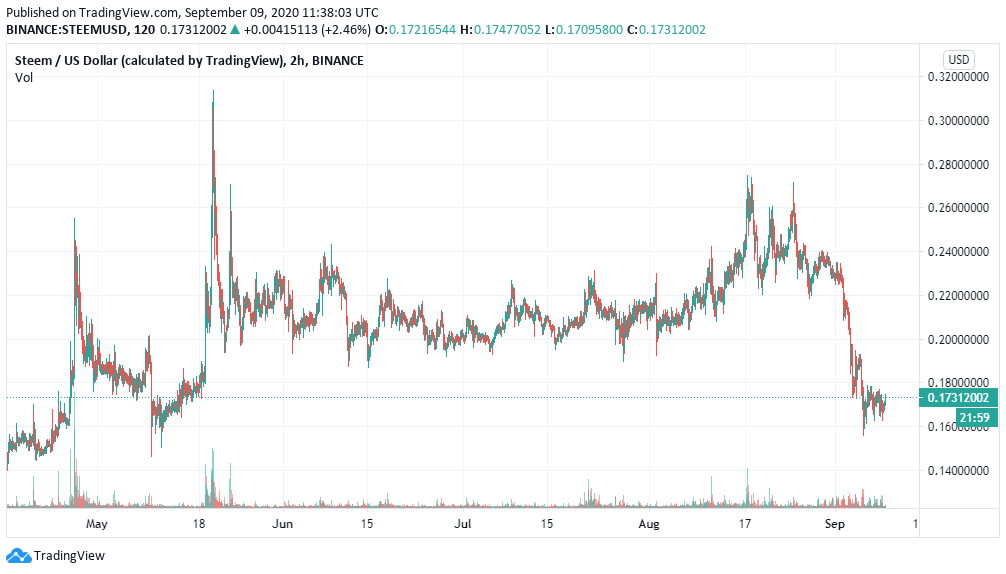
Here we have an even better cup & handle pattern. If you were thinking of giving up, please know that some very good times could be ahead very soon. This is a quick update made after noticing the TA on my own. Feel free to add your comments based on your expertise and experience. Above all, don't be greedy! Share around the good news and let your friends in on the potential trade :-)
Happy Trading!
Posted Using LeoFinance