In the first post of this series dedicated to talking about patterns in trading, I explained exactly what patterns are and talked in some depth about the Head and Shoulders pattern; but in this second post I come to talk about another type of pattern: The Double Top.
By the way, if you want to read the previous post where I've talk about Head and Shoulders Pattern, then here you are->Trading Patterns: Head and Shoulders
The Double Top is a Trading pattern in which the price of the asset (or crypto-asset) on the respective graph marks a rise to a certain level, then a decline and a subsequent rise to the same level of previous rise and then a decline to same level of decline as before. To explain it more easily, in the Double Top pattern you can see on the chart of an asset a candlestick formation or a price movement that gives the impression of a letter "M".
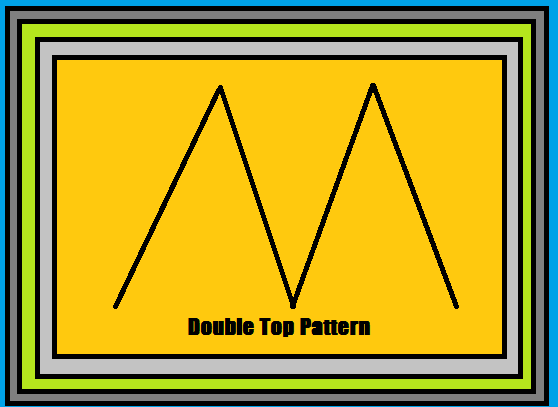
Image created by me
What does the Double Top pattern tell us in trading?
The double top trading pattern also (just like the head and shoulders pattern) tells us about a very likely reversal of the current trend. Technically speaking, the price will most likely not break the ceiling or the high that has been given, since it has hit the same top twice, therefore the price will most likely go down or the trend will reverse from bullish to bearish.
What does the double top pattern look like on a trading chart?
Let's look at an example of the double top pattern on the Ethereum 1 hour timeframe.
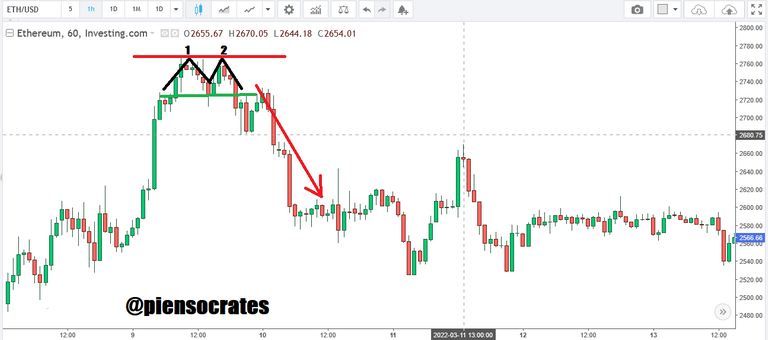
Image of the ETH chart in a 1 hour time frame on investing.com
As you can see, the price goes up to a point (point 1), goes down and then goes back up to point 2, which is exactly at the same price level where the previous high occurred.
And after that "M" formation, we can see the price start to fall, because the uptrend has reversed (from bullish to bearish).
Here is another example of the double top pattern on the Ethereum 1 hour timeframe again.
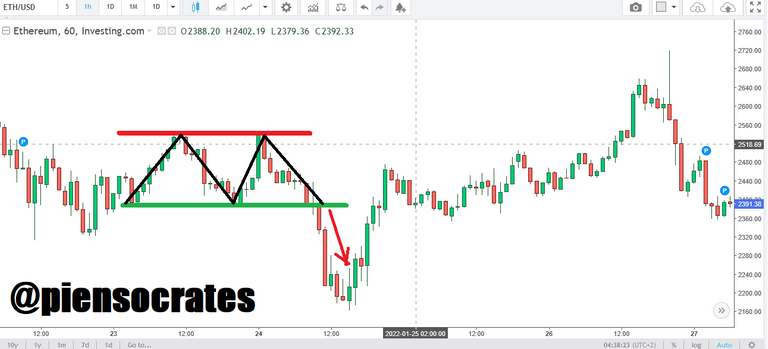
Image of the ETH chart in a 1 hour time frame on investing.com
As can be clearly seen, after the double top pattern occurred, the trend reversed (from bullish to bearish).
What benefit can a trader or investor get from the double top pattern?
When the double top pattern is properly identified on the chart of any asset (be it currencies, stocks, commodities or crypto); the trader can take advantage of it to go short, or to sell its holdings (in the case of trading crypto in the spot market).
I mean, speaking specifically in terms of crypto trading, thanks to the proper identification of this pattern, the trader will then be able to anticipate the drop in price or the change in trend and avoid losses (in the case of trading in the spot market); and to earn points if you are margin trading, by going short.
Things to watch out for when using this trading pattern
The double top pattern has a very good success rate in trading, but this is the case as long as it is identified correctly. And unlike other trading patterns, the complete identification of the double top pattern is not only knowing how to identify the configuration of the letter M in the price movement of the chart of the asset being analyzed, but we must also take into account something else: The volume.
And this is so because, if we do not take into account the trading volume, we can fall into the traps of the market by unsuccessfully identifying a double top pattern.
Therefore, full confirmation of the double top pattern requires checking the trading volume levels present on the chart at the particular time of the pattern. Therefore, if the conformation of “M” occurs in the price, but we see that the trading volume does not decrease, then we are in the presence of a market trap; which means that it is not the pattern itself but a false double top pattern; and that the price will most likely remain within the range or even continue to rise.
To confirm the double top pattern, we must then see the "M" formation on the price chart of the asset we are analyzing and we must see the volume indicator giving us a signal that the volume is really going down. With this in mind, we will already have full confirmation of a double top pattern and act accordingly.
Summarizing:
As we well know, one of the main things that we all traders try to do when analyzing the market is to anticipate trends; and this is because thanks to the trends we can obtain great profits in trading.
That is, when we identify a trend at an early stage, or even anticipate it before it starts, that is when we traders can really make big profits in the proccess.
When it occurs double top pattern, and it is properly identified, we traders can effectively anticipate reversals of upward trends and this therefore allows us to sell our asset holdings (thus avoiding losses that would occur in the inmediat Change of trend); or obtain profits, in the case that we putting on short position in margin trading..
What do you think of the use and usefulness of this trading pattern. Please comment.
Posted Using LeoFinance Beta