Investors on Europe (but also the U.S. market) should be on their toes next year.
These are the words of some analysts at Morgan Stanley, who predict a "double-digit" slump in 2022 after the great rise of the last year and a half. Overall, however, stock markets should advance next year as well, but to go beyond there will be a stronger reversal than those seen between mid-2020 until now.
According to the investment bank the global stock markets in 2022 will continue to grow, but certainly at a more moderate level; it then defined itself as a "slump buyer" meaning that the probable retracement will be seen by the market as a great opportunity to buy at lower prices.
The strong retracement could happen in the aftermath of the Federal Reserve's interest rate hike, which will bring financial instability, but only temporary.
Specifically for Europe, potential risks will be a reduction in aggregate demand, which would drive the European economy into stagflation, reducing corporate margins, and (unlikely) ECB tapering on peripheral European debt.
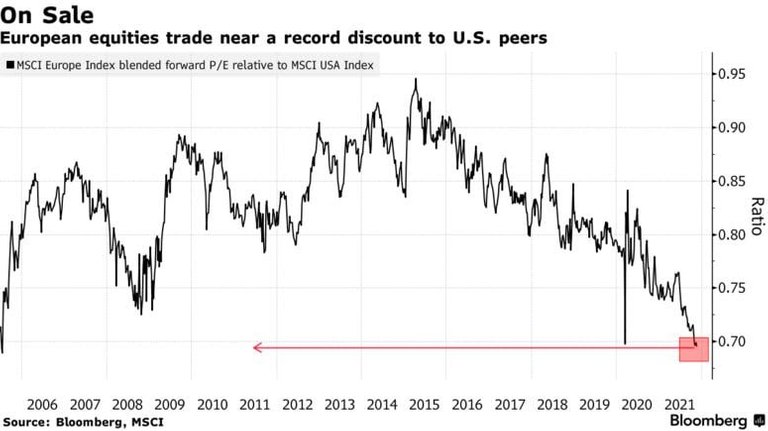
Morgan Stanley then reported that it will overweight Asian and European stocks to U.S. and emerging market stocks; Europeans are now trading at a record high versus the U.S. (see chart below). Of these, the Germans, again according to MS strategists, would be the most favored for 2022 with more exposure to the technology and energy sectors.
In the week ended Friday, equity funds received their lowest inflows since mid-October ($5.15 billion), hit by fears over rising inflation and mixed data on future growth and consumer sentiment.
Expectations of an interest rate increase in the USA as early as mid-2022 increased after the latest CPI data, the highest in 31 years.
U.S. and Asian equity funds saw large outflows (-$1.98 billion and -$0.35 billion), while European funds rose after Christine Lagarde conceded the extension of accommodative monetary policy and postponed interest rates until after 2022.
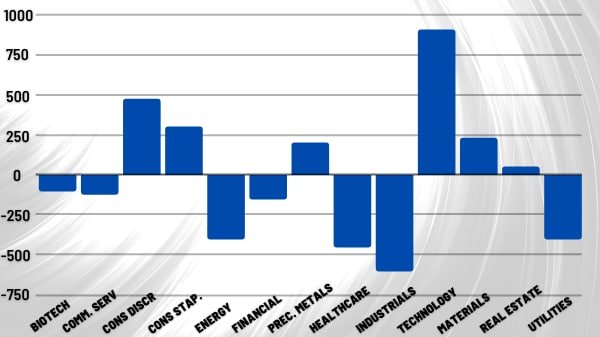
Technology and consumer discretionary saw the most inflows over the past week , allowing the Nasdaq to surpass previous all-time highs, while the worst performers were industrials and healthcare.
The technology sector was favored by a slowdown in the rise of interest rates on 10-year Treasuries, now at 1.55% and probably by fears of possible new lockdowns (especially in Europe).
 !
!
Inflows into bond markets also declined, down 39% from the previous week; US TIPS (inflation-linked) were the most sought after, while government bonds saw the largest increase in capital inflows since August 4 at $3.26 billion.
In contrast, corporate bonds were the worst, with an outflow of $655 million.
In the commodities market, precious metals funds received an inflow of $820 million, after 7 consecutive weeks of capital outflows, accompanying the price of gold to the highs of the beginning of June at $1875.
Energetics also did well, despite the losses of oil, which fell below $80: they recorded their 3rd consecutive week of inflows, at $124 million.
Regarding emerging markets, investors bought for the 3rd consecutive week equity funds for $431 million, but sold EM bond funds for $1.75 billion, the highest figure since August.
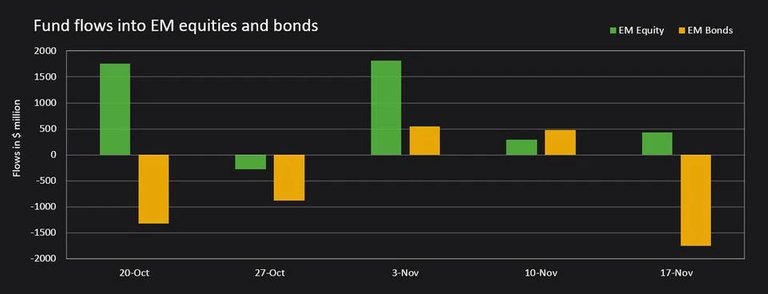
Capital inflows and outflows in emerging markets (millions of $)
We are approaching the time of year that in financial market jargon is called the "Christmas rally," which takes the entire month of December as its benchmark.
Historically this period is characterized by wide price fluctuations for the American equity market for several reasons; the lower presence of hedge funds operating, which reduce short positions, the rebalancing towards value stocks after the annual profits made on growth stocks and the preparation for the "january effect", a bearish period for the markets.
This year, however, the impact of lower liquidity could be felt more due to the speculative spirit that is affecting the equity market and the exit of hedge funds from the short-term bond market.
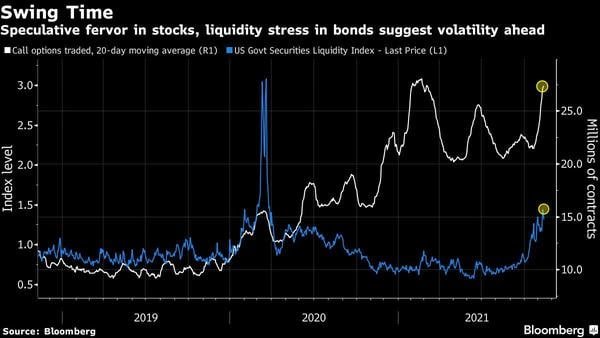
The 20-day average of call options (white line) has again risen to the highs of January 2021, while on the bond market (blue line) the liquidity index is soaring, thus signaling a lack of liquidity, which could lead to large fluctuations in bond prices.
The ICE BofA Move index, which measures volatility in the Treasury market, also remains high after reaching its highest level since March 2020 last week.
According to several market analysts, equity bullishness is now underestimating an equity bubble risk, while fixed income traders are much more nervous after the latest U.S. inflation rate data.
The decrease in year-end liquidity, added to the recent tapering initiated by the FED will be the ingredients of a December with many surprises, in which volatility and price swings could play a key role.
Bears and Bulls
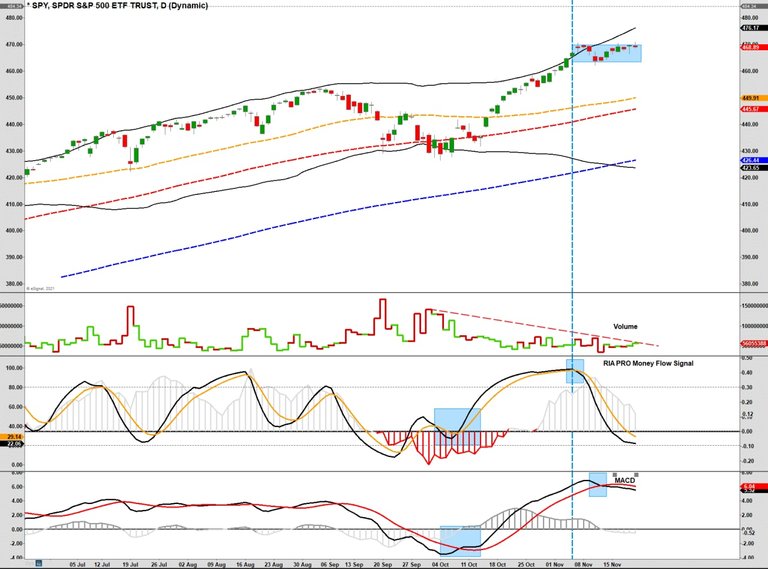
In this chart we see the MACD signaling this market weakness (last chart below).
Just above the MACD, we have a chart showing the flow of capital into the market. As we can see, this flow has reached historical lows, indicating that trading activity has been reduced to lows (lows also confirmed by the almost null volumes shown in the graph above).
These data indicate with good precision that we are facing a contingent weakness. If we were at the maximums of a bull market, traders' activities would be at the maximums.
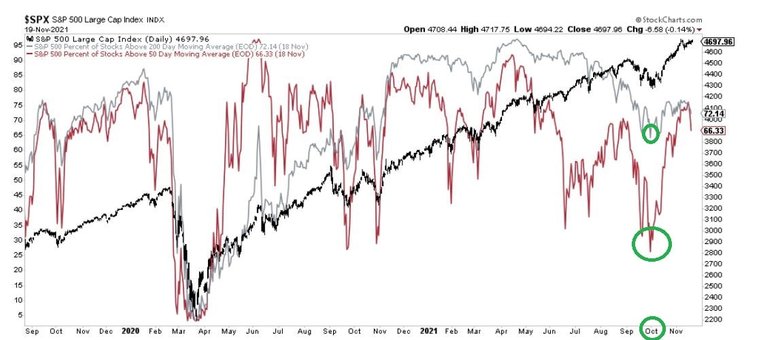
Another way to judge if we are at the top of an uptrend or not is to see the number of stocks that are moving above their moving averages.
At the beginning of October a good number of stocks on the US stock exchange were still below their moving averages. Compared to the situation at that time (green circles in the chart above), the number of stocks above the 50-day average (red curve) and those above the 200-day average (gray curve) have definitely increased, but they are still not comparable to the levels that were reached in the peaks of previous bull markets.
Honestly, looking at how the market has been moving since the end of the summer until today, I think that all the peaks in prices reached so far are due to speculations in derivatives on large capitalization stocks, which make all indices increase their value illusorily, even if most stocks are not involved in these movements at all.
A real bull market, I haven't seen it in the US stock markets yet.
Thanks for reading
Posted Using LeoFinance Beta


