Glassnode confirms the data reported last week, i.e. that the accumulation phase, characteristic of bearish trends following a previous bull market, seems to be over, while a very moderate distribution phase would have started, indicating the possible beginning of a new bull market.
The other week we had seen a chart showing the CDD, which is the rate at which accumulated bitcoins are spent on a daily basis to carry out transactions and operations. The chart showed a moderate increase in the rate at which accumulated coins are spent, which is confirmed this week as well. In the following chart we show the same concept with a different metric.
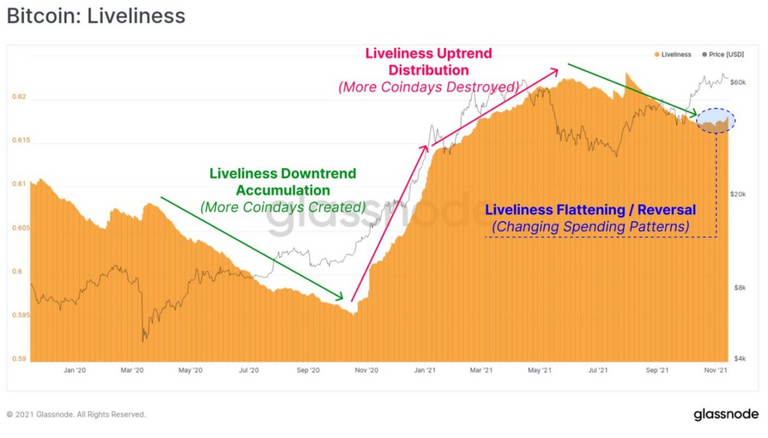
The indicator shown in the chart is called "liveliness" of the coins. The more the coins are held in storage, the less they are "vital", making the curve go down (green arrow on the right). As we can see (area in the dotted circle on the right), in the last two weeks the descent has flattened out and a slight rise seems to have begun, indicating a slight increase in the "vitality" of the coins.
INPUT AND OUTPUT FLOWS
In a healthy phase of distribution there must be a balance between the coins spent and those that enter from the deposits, that is between inputs and outputs in and from the deposits. In fact in the extreme phases of distribution, the incoming flow begins to be exhausted making the trade drain the availability of coins reducing the quotations. On the other hand in the early stages the balance between the two flows sustains the increase in quotations.
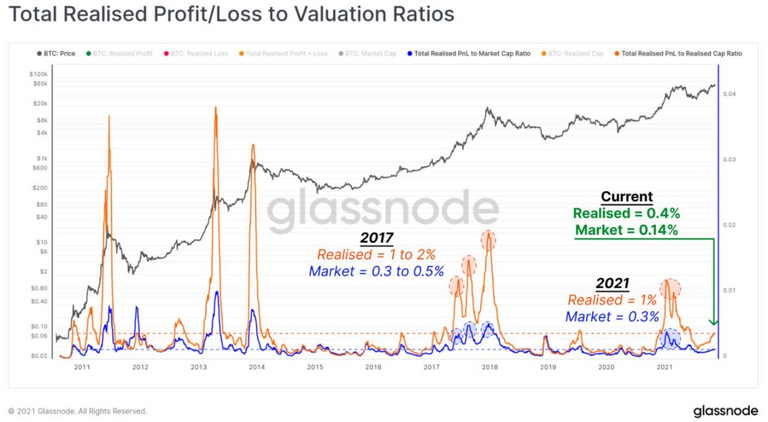
This graph summarizes different indicators that for brevity I do not post. In substance the diagram puts in relation the profits/losses of the operations executed in the week with the total market cap. Basically it represents the oscillations between the incoming flows and the total market valuation. In the circled areas we have the values that the two curves blue and orange had in correspondence of the maximums of a bull trend. As we can see, at the top of a bull market the orange curve reaches the value of 1%, while the blue curve reaches the value of 0.3%. Currently, however, the orange curve has reached 0.4%, while the blue curve has reached 0.14%, thus placing itself at about 50% of the values of the tops of a bull trend. This means that, at least for this indicator, we are still in the first half of our journey towards new bitcoin highs. In more technical terms, the chart indicates that inflows are largely capable of absorbing the "awakening" of traders' operations.
TOP MARKET INDICATORS
Finally, Glassnode reviews the leading indicators used to identify where we are in a bull market. Since they are very ingenious and interesting metrics, I publish all of them, even at the cost of being a bit long...

First on the list is the Mayer Multiple, which measures the distance between the btc quote and its 200-day moving average. The continuous red line is the threshold that precedes the maximum point of a bull trend and shows that we are still very far from it.
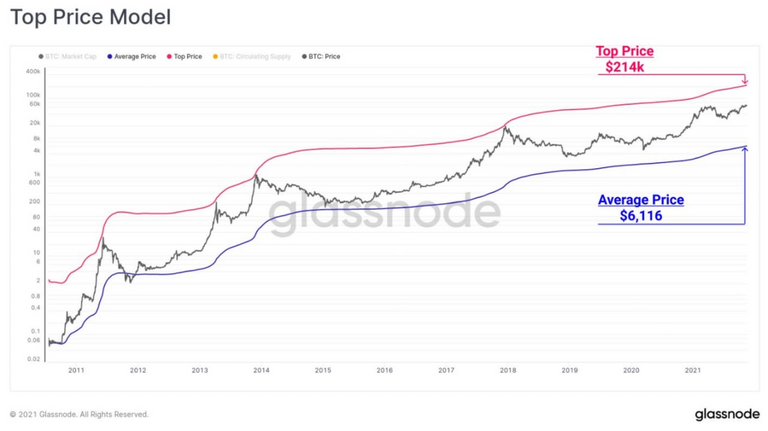
The Top Price, invented by Willy Woo, multiplies by a fixed factor (35) the total maximum average price reached by btc in its history. The slow change over time of this product is represented in the red curve. When the price of btc touches this curve, it means that we have reached an all-time high. As you can see, we are still a long way off....
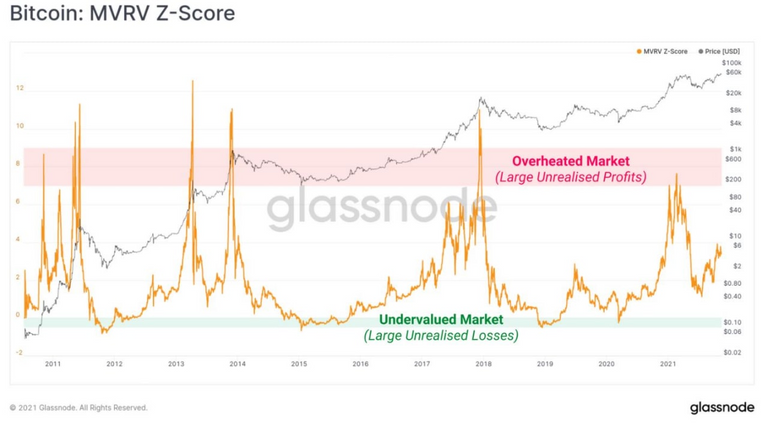
The MVRV Z-Score measures the distance in terms of standard deviation between the current price of btc and the price realized by traders in their closed trades (buy price - sell price). Obviously, in the early stages of a bull market the prospect of higher profits pushes trades higher (increase in the distribution phase), while in the late stages the scarcity of profits starts to reduce trades (decrease in the distribution phase). The graph shows that the orange curve is about halfway to the guard threshold indicated by the pink horizontal band.
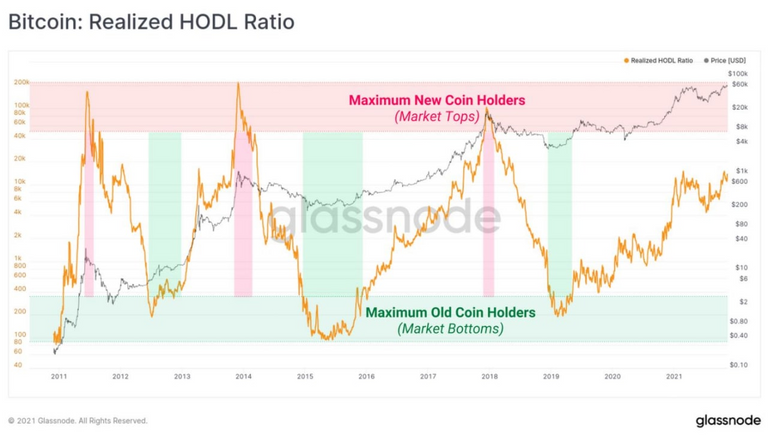
The Realised Hold (Hodl) Ratio basically measures the ratio of "old" coins to "young" coins. The orange curve reaches the peak when the "young" coins are very prevalent (phase of extreme distribution: many coins moved and few accumulated to deposit). According to this graph we are at 2/3 of the way to the maximum quotations (pink horizontal band).
I hope you find this post useful. Thanks for reading.
Posted Using LeoFinance Beta
