The "capitulation" of the crypto market, presumably piloted on par with traditional exchanges, shows that planned events can become more dramatic than those that occur spontaneously.
Metrics data sometimes show values that exceed those of the previous cycle, in which the capitulation was a spontaneous event.
As the following graph shows, for example...
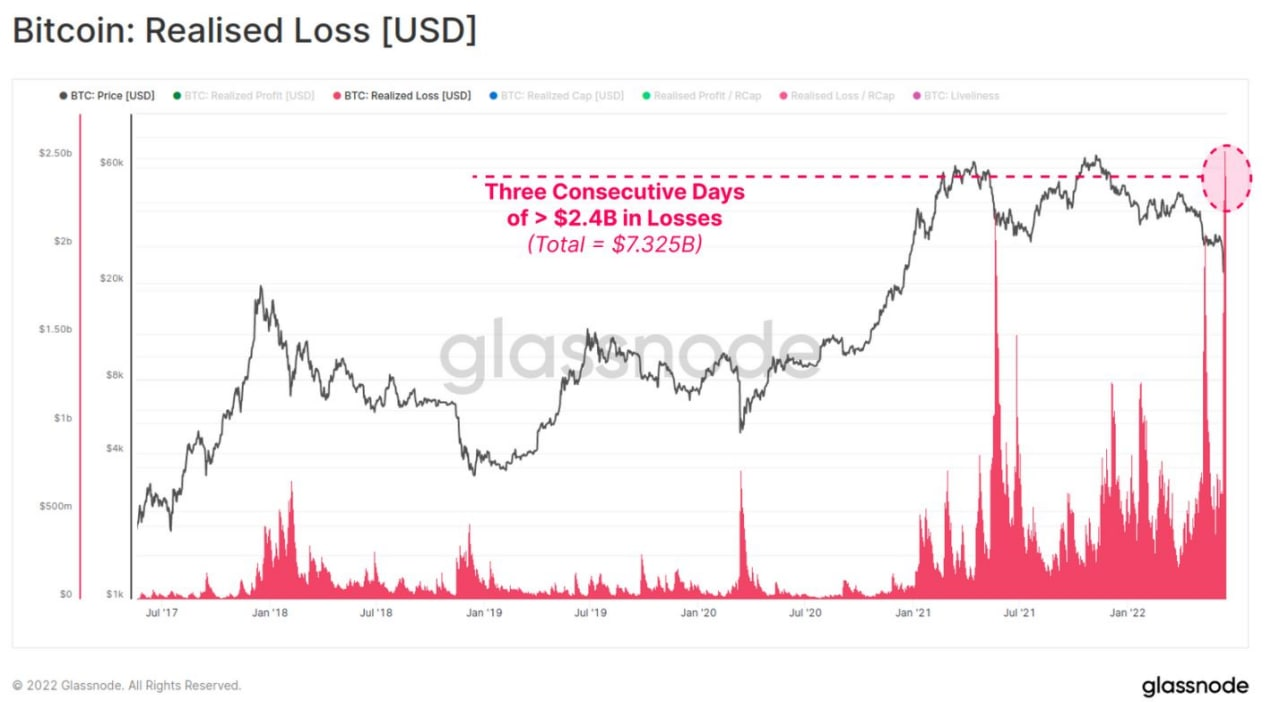
The "Realized Loss" of btc for example, which we have also seen in recent weeks, has now reached a new all-time high, surpassing that of 2017.
THE MINERS: THE LITMUS TEST OF THIS CAPITULATION
Are miners capitulating or not? I see this as an increasingly problematic issue.
And it is not a purely "academic" issue....
A capitulation of the miners, if proven, would suggest that this market crash has at least some "natural" element and is not just externally maneuvered...
Let us see in this regard what the following graphs tell us...
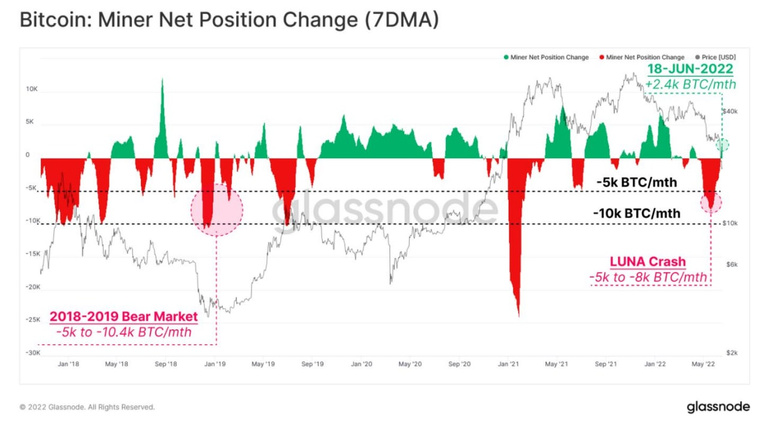
It is true that until early June there was selling by miners at the rate of 5-10 thousand btc per month (last red band on the right).
But as soon as the long period of consolidation -- in which btc prices seemed to be pinned at $30-28000 -- abruptly stopped, miners resumed accumulating at a rate of 2.4 thousand btc per month, despite the fact that the price of btc was falling to current lows (green circle on the right).
It is difficult in this case to speak of "capitulation," as the maximum btc sales did not coincide with the price collapse.
Other parameters used by Glassnode to assess stress on miners, such as profitability and production costs actually provide indirect measures.
We can only say that these factors have gotten to the point where it is difficult for mining plants to be sustainable, but we know nothing about the reaction of miners in the face of such difficulties.
Variations in hashrate and difficulty, on the other hand, allow us to infer any actual closures of mining facilities, which directly impact the two factors considered.
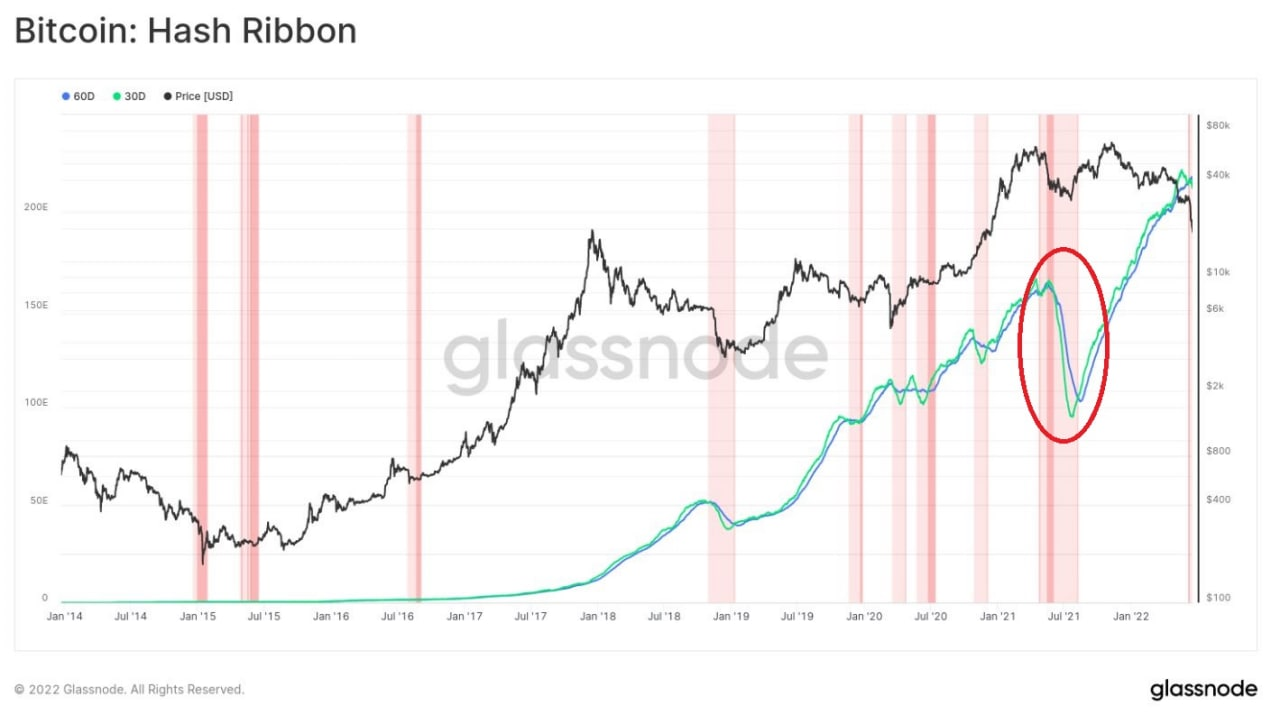
However, if we compare the current changes, e.g., the decrease in hashrate (far right in the graph), with the one that occurred between May and July 2021 (red circle), coinciding with the banning of miners from China, we realize that the current decrease is minor.
I therefore continue to doubt an alleged "capitulation" of miners.
As I said at the beginning, the capitulation of miners would be a spontaneous market phenomenon, as it is directly caused by higher production costs and lower prices of the "raw material," i.e., btc.
The fact that such a phenomenon does not really appear to be taking place increases the likelihood that the current "capitulation" of the crypto market is an induced, rather than spontaneous, event.
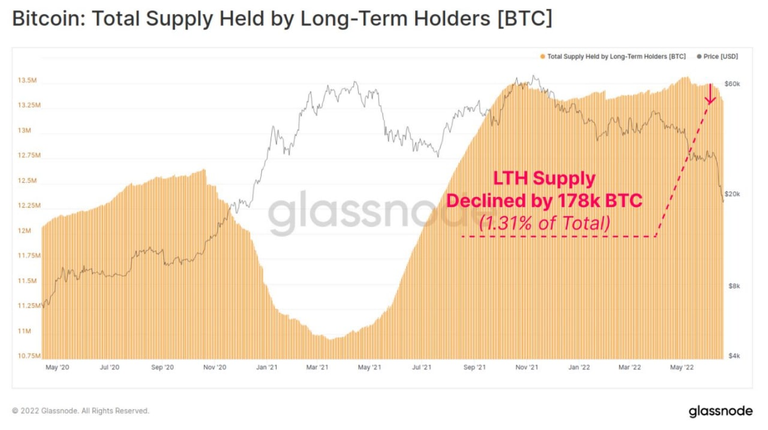
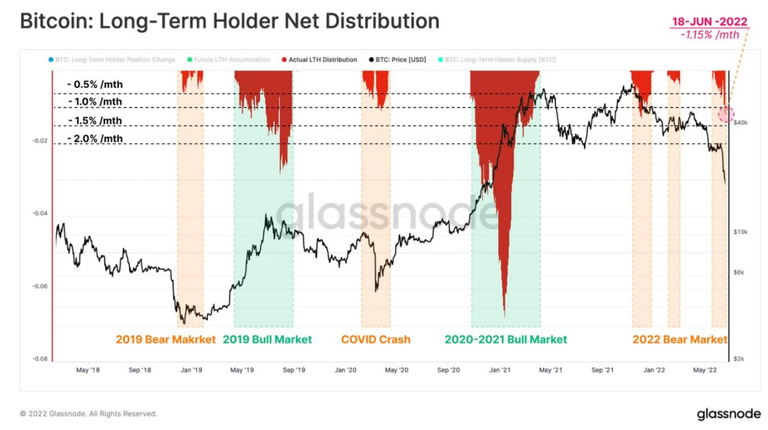
Some metrics tell us that there is also selling lately by "strong hands," that is, by long-time holders.
In this graph for example, we see a reduction in the reserves of these holders (red arrow on the right).
Who can say, though, whether these sales were really triggered by "fear" or whether they were done on purpose by the "strong hands" to drive prices down?
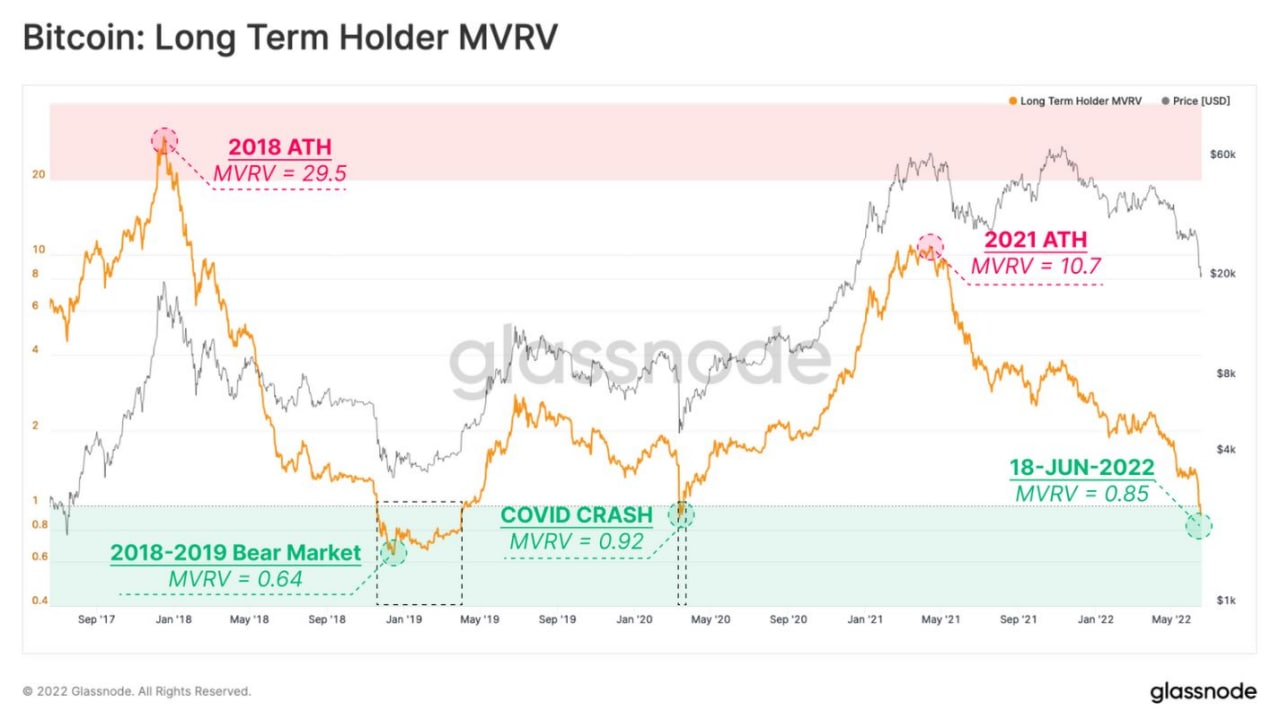
This graph shows that current sales by holders (yellow curve) have reached a level comparable with that reached at the outbreak of the pandemic, but it is not remotely comparable with the sales that occurred in the bear market of the previous cycle of 2017-2019.
Those at Glassnode also, confirming their intellectual correctness, present us with this graph as well, where we can see that in fact the maximum peaks of selling by holders occur at the highs of a cycle, not the lows.
So holders are characterized as those who sell en masse when they need to bring home profits, while in contrast they are not wont to "panic" by making mass sales on lows.
It is therefore difficult that they will behave differently this time.
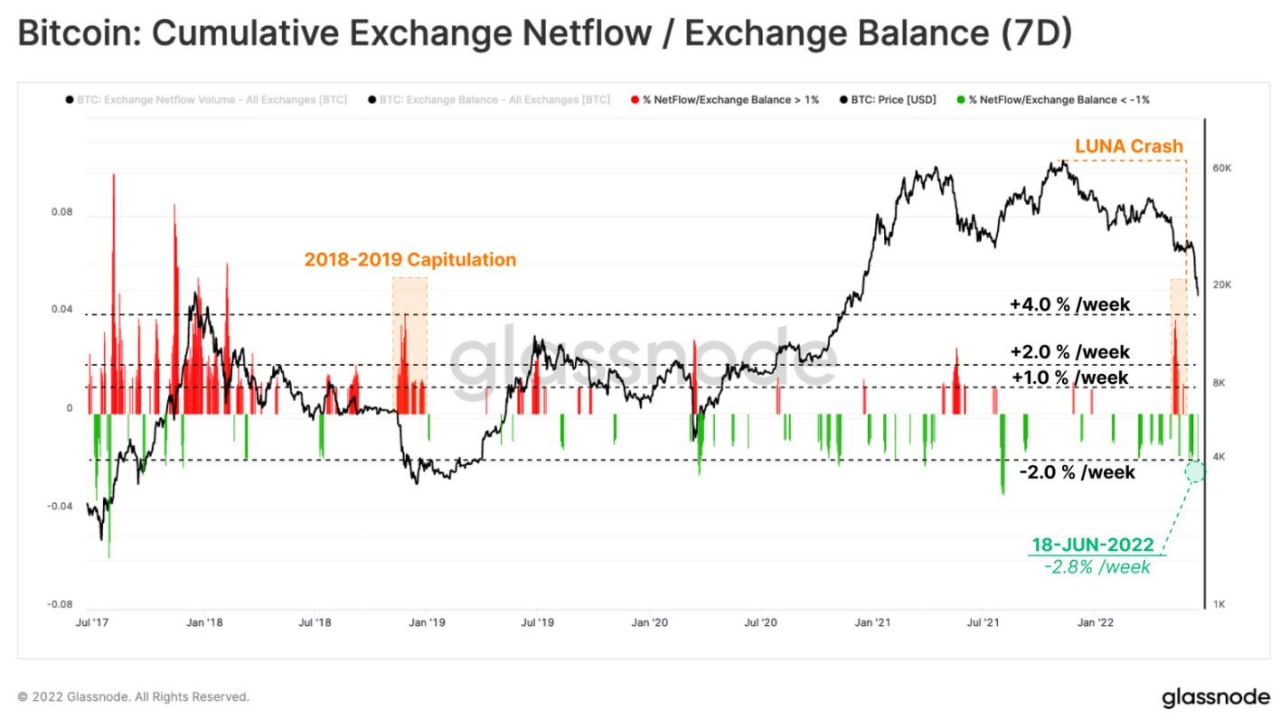
Another interesting indicator that is giving us ambiguous signals is the one that measures the flow of btc into (in red) and out of (in green) the exchanges.
Usually, in sharp declines the inflow (red) increases, because in order to sell coins you first have to place them on the market in an exchange.
We can see thus that in fact in the Earth-Moon crash there was a strong flow of sales on the exchanges (red peak highlighted by the rectangle on the right).
But then in the subsequent declines we had outflows (green) not inflows, reflecting the fact that the selling that caused the "capitulation" of btc below the 20,000 threshold certainly did not occur predominantly on the exchanges, but was amplified by strong liquidations of leveraged positions on derivatives and by strong, targeted selling (perhaps with manipulative intent) by institutional investors (the "strong hands" we mentioned earlier).
In conclusion, based on this ambiguous data we are unable to say whether btc will be able to hold support around 20,000, confirming its historical habit of never falling below previous cycle highs.
It all depends on the nature of these price drops, which seem to be only partially a spontaneous product of the market and therefore only to a certain extent are monitorable with the tools we have at our disposal.
So all we have to do is wait for any signs of exhaustion in this selling pressure generated by derivatives and "strong hands."
SOURCES
https://insights.glassnode.com/the-week-onchain-week-25-2022/
Posted Using LeoFinance Beta