We now comment, as we do every week, on some of Glassnode's metrics.
We note with satisfaction that these latest metrics are perfectly consistent with the views we expressed in our last article yesterday and thus comfort us that perhaps our view of the market is going in the right direction.
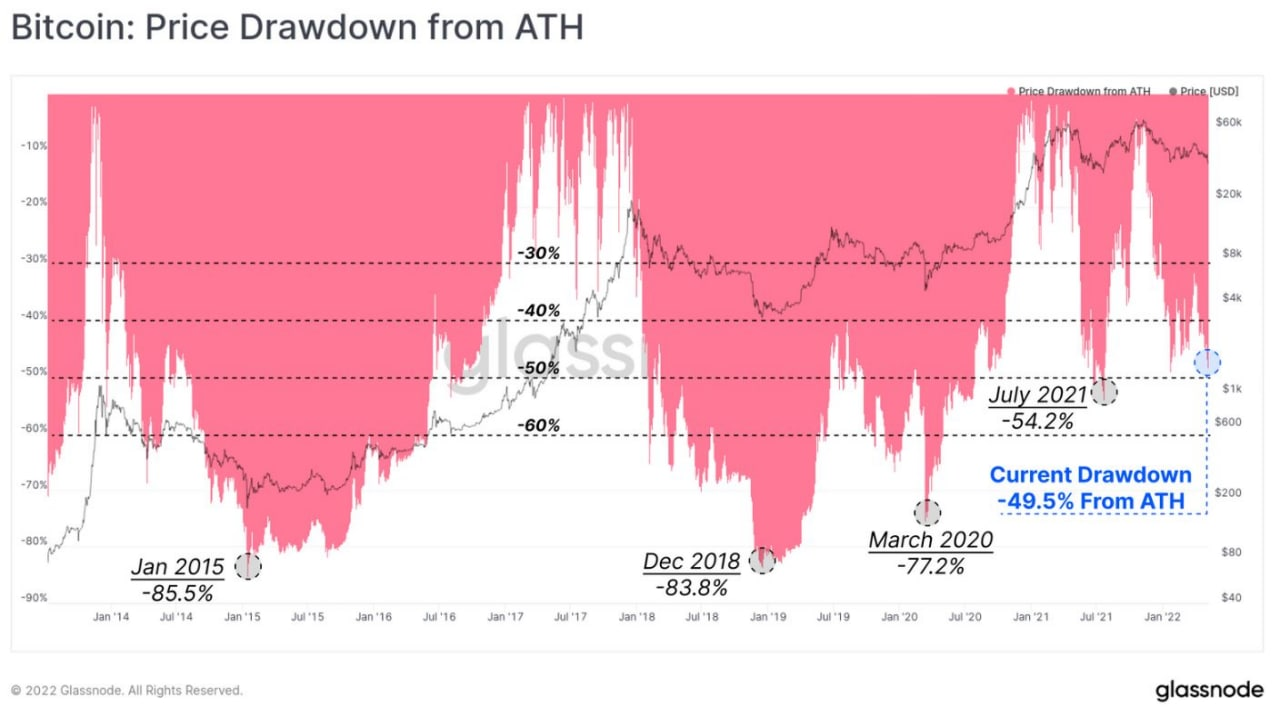
This chart shows that bitcoin's current decline is still far below the final declines of previous cycles (2020, 2018, 2015, gray circles).
This figure can be read in an optimistic or pessimistic key:
optimistic key: prices are still effectively supported by the factors discussed in recent weeks.
pessimistic key: prices still have room for further declines if the factors in point 1 begin to fail.
The next graphs lean toward the hypothesis of point 2.
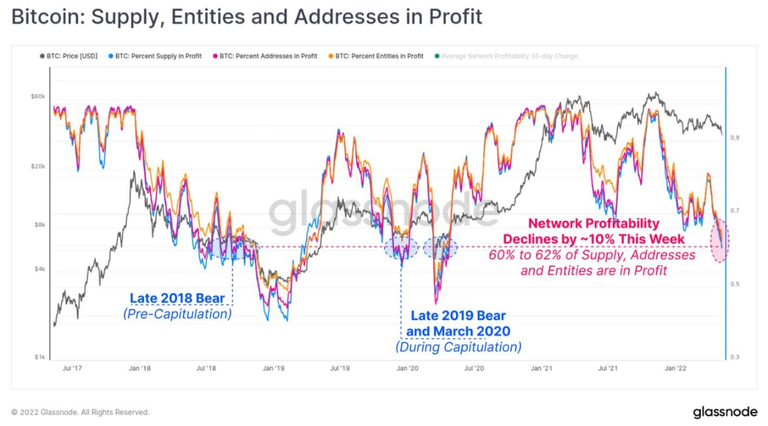
Here "profitability" is measured, i.e., how many of the coins now held by traders and investors were bought at prices below current prices and are therefore at a loss.
Any drop in profitability is a risk factor that can trigger panic selling.
The graph shows that profitability has fallen to levels already seen in the latter stages of previous cycles.
At those same levels, each cycle ended with a final sell-off (the final low point of the cycle we discussed in yesterday's article).
So it is safe to assume that with the break of the $38-45,000 range established earlier as support, bitcoin could fall below 30,000 and in those territories establish its absolute low for this cycle. At that point, the 2020-2021 cycle can be declared completely over.
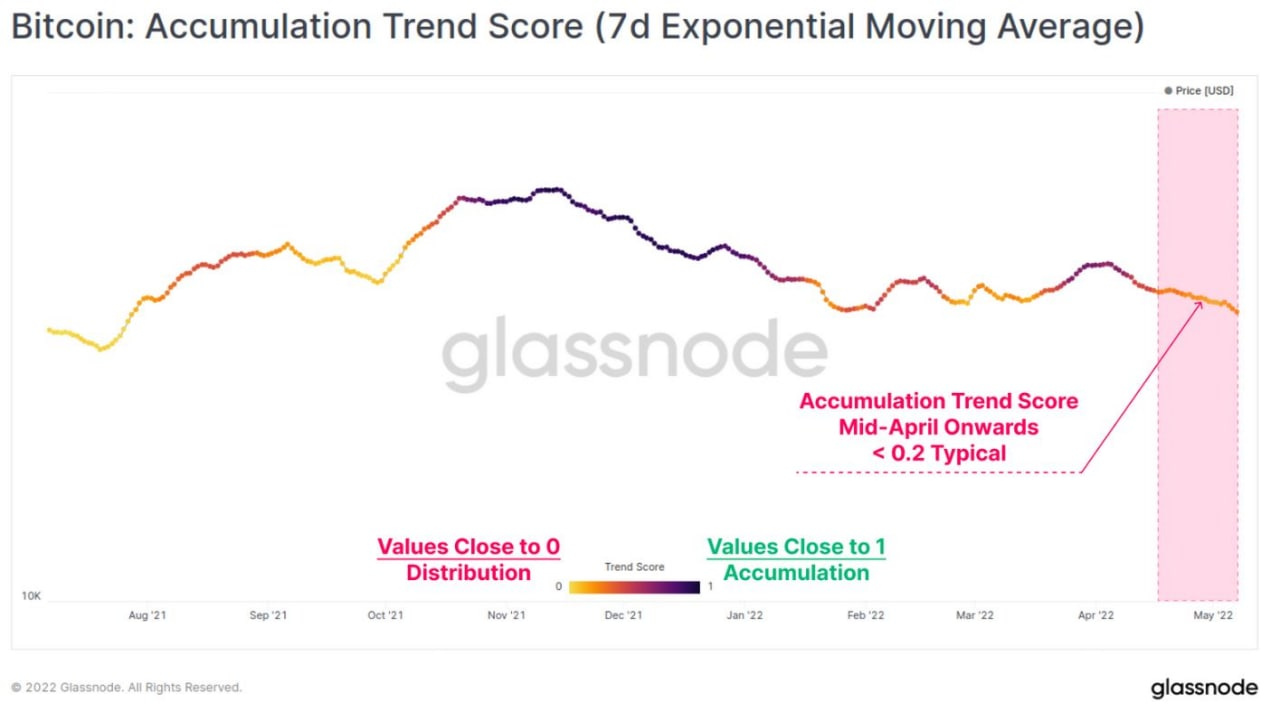
This summary chart puts together detections made in the various sectors of the market (spot market, flows in the exchanges, derivatives, Etf, etc.) and defines in a simple way which phase of a cycle we are in.
According to these readings, the accumulation phase is weakening to give way to a new distribution phase.
This is also in line with what we were saying in yesterday's article: the factors (especially institutional accumulation in the U.S.) that were compressing volatility and freezing prices in a very narrow range (the famous $38-45,000 range) are losing their grip to give way to new price dynamics that are still embryonic.
In all likelihood, the first dynamics to emerge from this "liberated" market will be in a bearish direction.
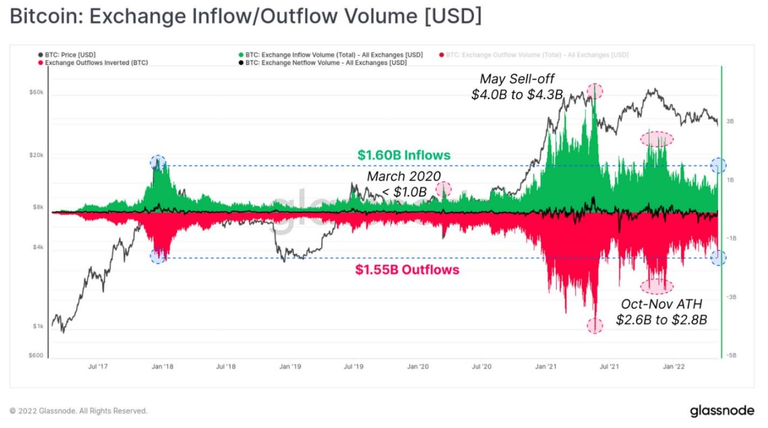
The market's newfound dynamism is also reflected in a new influx of capital into the exchanges (to make defensive transactions: selling coins, opening short positions in derivatives, etc.).
The inflows are in green.
See how the level of this inflow has returned to be comparable to those of recent cycles and mini-cycles (especially that of 2017). A sign of a major market unwinding.
Moreover, seeing what happens at the btc price level (upper black curve) at these inflows, one understands how inflows of some importance (i.e., higher levels of green waves) are always correlated in some way with bullish cycles that arise later.
The underlying principle of this observation is that, as we said, the end of accumulation creates some market unwinding and, after any further declines to cycle lows, triggers a new bullish cycle.
In other charts that I will not include for brevity, we see that the current declines are no longer predominantly created in the derivatives market, but are caused by share sales in the ETFs (the Canadian ones, which invest in real crypto and not in derivatives). So here again there is a reversal of the recent trend in which derivatives predominated while the spot market was like "frozen."
In conclusion, the Glassnode data also confirm that we are at the end of the 2020-2021 cycle.
We're in for the last few downturns, which are usually the most psychologically terrifying.
But from the end of this cycle will then emerge new dynamics that will form the basis for a subsequent cycle.
So goes life, for those who invest in crypto...
SOURCES
Posted Using LeoFinance Beta