This week Glassnode's metrics provide nothing new from what we have seen in the past few weeks, so I will not post redundant charts repeating the same things over and over again.
The market is virtually at a standstill and there are only moments of accumulation in some investor groups.
So there is plenty of time to reflect on the past, comparing the current moment with something similar that happened in the previous cycle (2017-2019). And that is precisely what Glassnode does with the following graph:
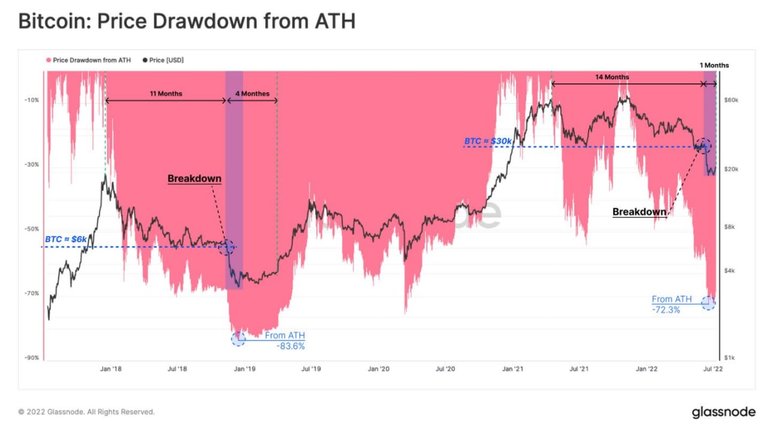
The chart simply compares the pattern of btc declines that occurred in the previous cycle with that of the current cycle.
In both cases we have an initial sharp fall in prices, followed by a further fall, which we call "capitulation" (the small dashed circles indicate the level that forms the boundary between the two declines).
In the graph, we have on the left the pattern of the previous cycle:
an 11-month descent to the $6,000 level
a 4-month capitulation, with an initial vertical descent of an additional 50 percent from the maximum quotation of that cycle, down to $3000, a level that is then held for a long time.
Today we have the same pattern:
a 14-month descent (somewhat strange, because it is formed by two consecutive descents from two almost identical highs) to the $30,000 quotation
a capitulation with a further 40 percent decline to $17-20,000.
In this cycle, the $30,000 level served the same function as the $6,000 level of the previous cycle. These are both prices below which most traders were no longer willing to hold their positions.
In contrast, the levels of 3000 and 17-20,000, respectively, are price ranges that in the two cycles have also prompted some groups of holders to sell their positions, but at the same time arouse the interest of other groups of holders who initiate strong accumulations (we saw last Tuesday which groups of investors are involved in this double game).
If the similarity between the two cycles is respected, the $17-20,000 range could be the final support of this descent.
By final support I mean the price level at which the declines begin to cross with moments of increasingly strong accumulation that manage to put a long-term brake on the descent.
In the previous cycle, this cross between descent and strong accumulation around $3,000 lasted 4 months before the next bullish cycle began.
Currently the level at 17-20,000 has held for a month. Hopefully it will hold for a long time to come.
Posted Using LeoFinance Beta