Bitcoin and the distances from the sliding averages
As soon as a market looks like a flagpole, some people ask themselves if it will go on like this forever. The answer is of course no, no chart in the world can sustain this growth forever. How far a movement can go we usually see in the historical charts of the market.
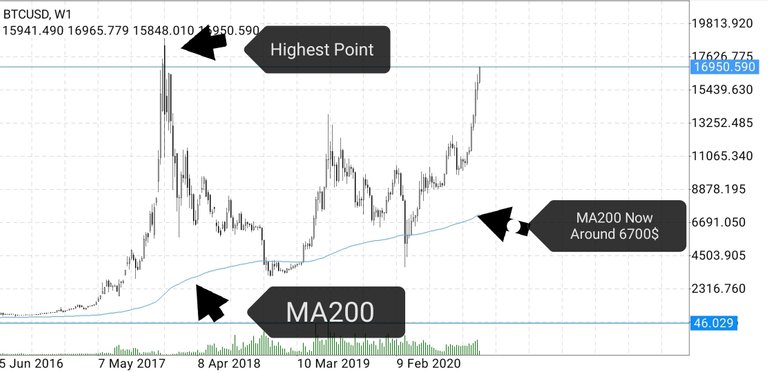
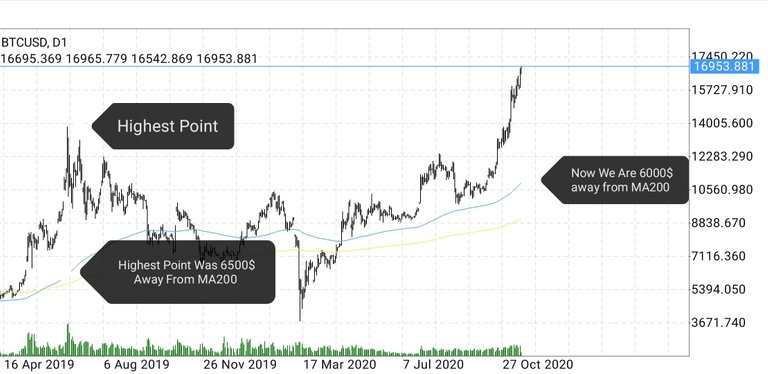
In Bitcoin the Moving Average 200 is a fixed size, exactly the same as in the stocks and Forex markets. Here the average value of 200 candles is determined and this on each time unit. In my example I have chosen the weekly chart and the daily chart, because these are probably used by most market participants.
On the daily chart we see in the past a maximum Price difference of 6500$. Now you could simply project this difference into the future and you would have a target on top. In this example we would have a difference of 6000$ and everybody can draw his own conclusions.
On the weekly chart, however, things look a bit different, because here we still have room to move up.
If you take into account the first rise in Bitcoin, we would have about $7200 of air on top. If we add this to the current price of around $17000, we would have a possible target at around $24,200. This is, of course, pure speculation and will probably not be able to be started without corrections.
As soon as we see a correction on these time units, we also give the MA200 a chance to reduce the large gap. Corrections are good and always provide opportunities.
Translated with www.DeepL.com/Translator (free version)
Bitcoin und die Abstände von den gleitenen Durchschnitten
Sobald ein Markt aussieht wie eine Fahnenstange, stellt sich so mancher die Frage ob es jetzt ewig so weiter geht. Die Antwort darauf ist natürlich nein, kein Chart der Welt kann dieses Wachstum ewig durchhalten. Wie weit eine Bewegung laufen kann sehen wir meist in den historischen Charts des Marktes.
Im Bitcoin ist der Moving Average 200 eine feste Größe, genau so wie in den Aktien und Forexmärkten. Hier wird der Durchschnittswert von 200 Kerzen ermittelt und das auf jeder Zeiteinheit. In meinem Beispiel habe ich den Wochenchart und den Tageschart gewählt, denn diese werden wohl von den meisten Marktteilnehmern genutzt.
Auf dem Tageschart sehen wir in der Vergangenheit eine maximale
Preisdifferenz von 6500$. Jetzt könnte man diese Differenz einfach auf die Zukunft projizieren und man hätte ein Ziel auf der Oberseite. In diesem Beispiel hätten wir aktuell schon eine Differenz von 6000$ und da kann jeder seine eigenen Schlüsse draus ziehen.
Auf dem Wochenchart sieht die Sache aber noch etwas anders aus, denn hier haben wir noch Luft nach oben.
Wenn man den ersten Anstieg im Bitcoin berücksichtigt, dann hätten wir jetzt noch ca. 7200$ Luft auf der Oberseite. Rechnet man diese auf den aktuellen Preis bei rund 17000$, dann hätten wir ein mögliches Ziel bei rund 24.200$. Dies ist natürlich pure Spekulation und wird wahrscheinlich auch nicht ohne Korrekturen angelaufen werden können.
Sobald wir auf diesen Zeiteinheiten eine Korrektur sehen, geben wir dem MA200 auch eine Chance den großen Abstand zu reduzieren. Korrekturen sind gut und ermöglichen immer auch Chancen.
Source Charts: (Guidants/Godmode Trader) & JFD Broker & Binance
Für mehr Informationen rund ums Trading empfehle ich meinen
Discord Channel: https://discord.gg/j5A3CUq
Twitter: https://mobile.twitter.com/TraderOut
Ref Links Broker:
Werbung wegen Markennennung
Trade Republic: https://ref.trade.re/vwxxl228
Binance: https://www.binance.cc/en/register?ref=QB18DEMH
Risikohinweis:
Dieser Post stellt keine Anlageberatung oder sonstige Empfehlung dar.
Die dargestellten Analysen, Techniken und Methoden dienen ausschließlich Informationszwecken
und stellen weder eine individuelle Anlageempfehlung noch ein Angebot zum Kauf oder Verkauf
von Finanzinstrumenten dar, sondern spiegeln lediglich die Meinung des Referenten wider.
Eine Haftung ist ausgeschlossen.
Legal Disclaimer:
I am not a financial advisor
nor is any content in this article presented
as financial advice. Never invest more
than what you can afford to lose.
This post is my personal opinion,
do your own research before making any investment decisions.
If you make any trades after reading this post,
it is completely in your responsibility.
I am not responsible for any of your losses.
By reading this post you acknowledge and accept that.
Posted Using LeoFinance Beta