Bitcoin seems to have a pattern around its halving
It can be summed up with: "prices go up!"
More specifically, looking at the chart it looks like bitcoin tends to make a new all time high roughly 2-9 months post halving:
(Source:
1227963246151335945) twitter metadata:Yml0aGFyaW5ndG9ufHxodHRwczovL3R3aXR0ZXIuY29tL2JpdGhhcmluZ3Rvbi9zdGF0dXMvMTIyNzk2MzI0NjE1MTMzNTk0NSl8 ~~~
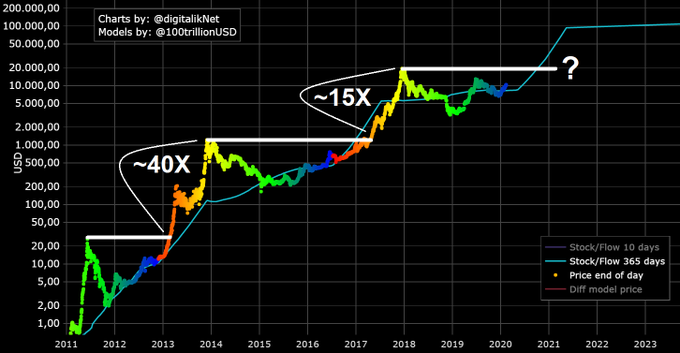
Then, after it makes a new all time high it tends to run for the next 9-11 months.
During this time it goes anywhere from 40x to 15x higher than the previous all time high.
Even if that is a trend instead of a range and the next halving ONLY produces gains of 6x, we are looking at a peak of $120k in bitcoin.
Not a lot of data to go off of, but considering it has to do with supply/demand economics as well as human behavior it seems likely it could play out in similar fashion again.