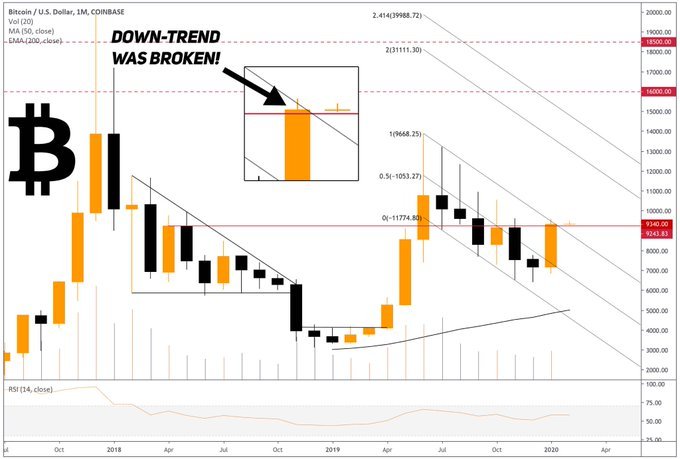
The monthly chart shows that Bitcoin has officially broke the downtrend
I don't look at the monthly chart that often, but I feel like when I do I often learn some things
This time was no different.
Looking at the monthly candlestick chart of bitcoin it looks very much like bitcoin has officially broke its downtrend from $14k.
Sees:
(Source:
1223621488382746626) twitter metadata:S2xvbmRpa2VSdXNofHxodHRwczovL3R3aXR0ZXIuY29tL0tsb25kaWtlUnVzaC9zdGF0dXMvMTIyMzYyMTQ4ODM4Mjc0NjYyNil8 ~~~
Now, if that is the case then the measured move says we should be going up near $20k on this next surge.
The problem is where do we buy back if we try to sell some at $20k, because if/when it does pullback it won't be for that much.
I am guessing we will be hoping for like $14k on a big pullback to buy back in.
Those will be fun times...